


Exploring the subtleties of the formulation and preparation of Metal Injection Molding feedstocks
A technical session, comprising three papers, at the Euro PM2021 Virtual Congress, organised by the European Powder Metallurgy Association (EPMA) and held from October 18–22, 2021, assessed various aspects of the formulation and preparation of feedstocks for Metal Injection Molding. Dr David Whittaker reports on three papers that addressed solvent debinding efficiency, strategies for enhancing the debinding of polyacetal (POM) feedstocks, and, lastly, an analytical method for enhancing the understanding of the homogeneity of Metal Injection Molding feedstocks and green parts. [First published in PIM International Vol. 15 No. 4, Dec 2021 | 30 minute read | View on Issuu | Download PDF]
Effect of backbone selection on the solvent debinding of Metal Injection Molding feedstocks
The first paper featured in this review came from Christian Kukla, Santiago Cano, Stephan Schuschnigg, Clemens Holzer and Joamin Gonzalez-Gutierrez (Montanuniversitaet Leoben, Austria). It considered the effect of backbone selection in MIM feedstocks on the efficiency of solvent debinding [1].
At least two components are necessary in MIM feedstock binders: the backbone, to provide strength and shape retention during the removal of the other binder components, and the main binder component to provide flowability during the injection moulding process.
Organic solvents or water can be used to remove a portion of the binder, followed by thermal debinding to eliminate the remaining binder components. During solvent debinding, interconnected pore channels are left, allowing the decomposition products in thermal debinding to leave the part. If the binder components are not adequately selected, defects – such as cracking, distortions or slumping – can be encountered during solvent debinding. The binder component to be removed in thermal debinding is the backbone. The backbone must be low cost, chemically resistant to solvents used in solvent debinding and easily removable by thermal degradation. These requirements are fulfilled by polyolefins, the most commonly used being high-density polyethylene (HDPE), low-density polyethylene (LDPE), and polypropylene (PP).
For high performance, the binder should show good adhesion to the powder. In many cases, an additive achieves this. Stearic acid (SA) is commonly used for this purpose in PIM. Another possibility is the use of grafted polyolefins; grafting introduces suitable polar sites onto the chains of the polymers, thus improving the adhesion between polymers and particles with different polarities. The use of grafted polymers as PIM feedstocks has not, to date, been extensively studied. Therefore, the reported work looked at the behaviour of different backbones and grafted polyolefins, comparing the debinding performance, morphology and thermal degradation of feedstocks with grafted backbones.
The major fraction of the binder in the studied feedstocks was composed of two waxes, added to adjust the viscosity of the binder system and as components soluble in n-heptane. The insoluble fraction was the backbone. Feedstocks with maleic anhydride-grafted and non-grafted polypropylene and high-density polyethylene backbones were evaluated. Stearic acid was added to the non-grafted backbones as a dispersant agent, at a similar weight fraction to that used for grafting.
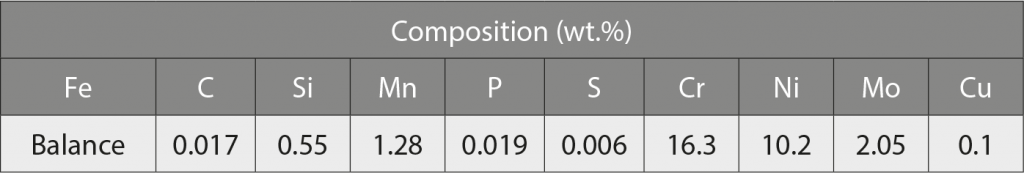
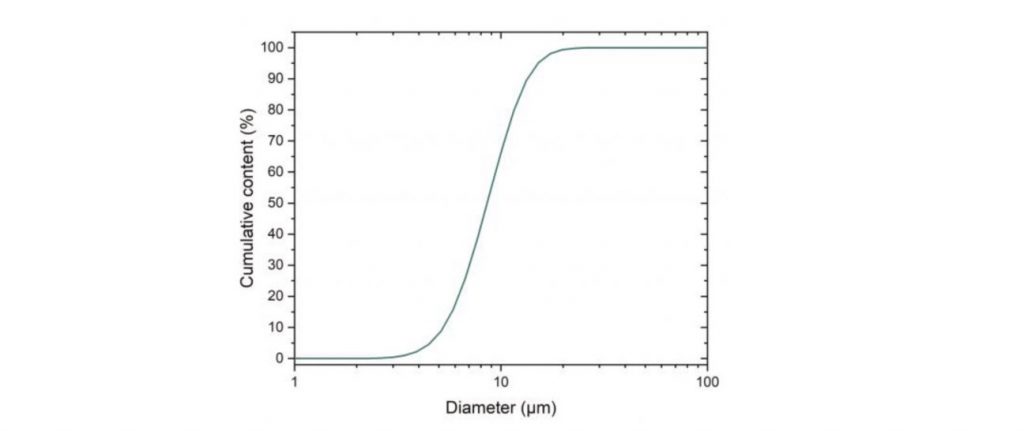
The powder used was gas atomised 316L stainless steel, with the chemical composition shown in Table 1 and a particle size distribution shown in Fig. 1.
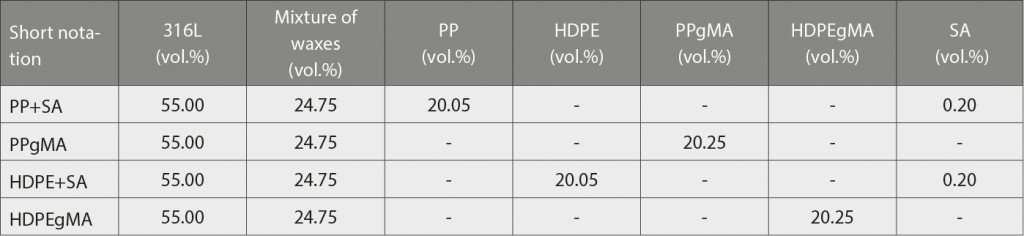
Feedstock materials were prepared in a laboratory-scale kneader with counter-rotating rollers. The set temperature of the kneader was 185°C, the rotational speed of the rollers 60 rpm and kneading time 30 min. All of the binder components were introduced together to the kneading chamber and, after they were completely melted, the stainless steel powder was added. After compounding, the material was ground using a cutting mill with integral sieve. The feedstock formulations are shown in Table 2.
Cylinders with 8 mm diameter and 5 mm height were compression moulded in a vacuum press. The compression cycle comprised (i) pre-heating the material for 40 min at 1 bar, at the maximum temperature, (ii) compression at 50 bar for 5 min at the maximum temperature and (iii) cooling to 30°C and compressing at 50 bar for 15 min. The maximum temperature was adjusted for each feedstock on the basis of preliminary trials at temperatures between 150 and 190°C. The selected temperatures were 175°C, 185°C, 160°C and 150°C for the PP+SA, PPgMA, HDPE + SA and HDPEgMA feedstocks, respectively.

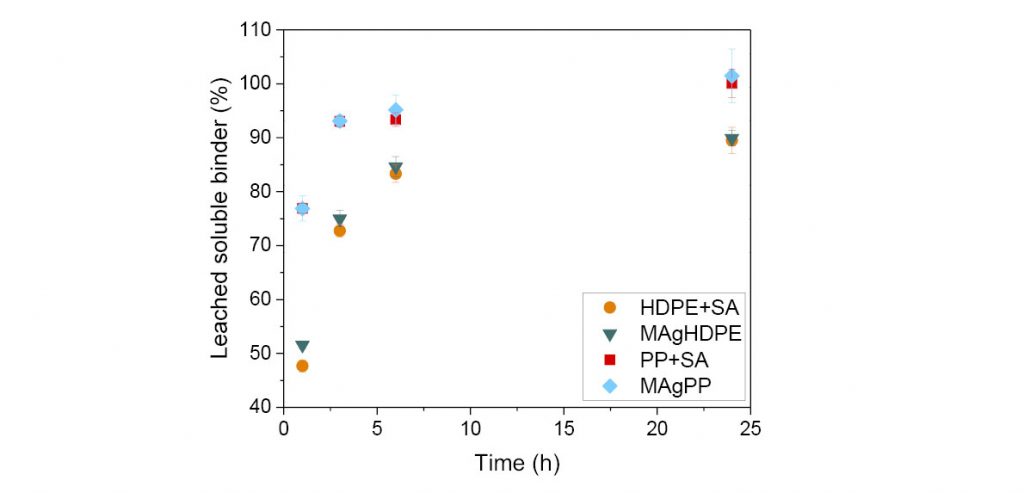
With regard to solvent debinding behaviour, Fig. 2 shows the leached soluble binder for the four feedstocks investigated. Feedstocks containing polypropylene lose mass faster than those containing HDPE, regardless of whether grafting or SA was used. Feedstocks containing PP reach 100% soluble content removal after 24 h, while materials with HDPE reach only 90%. This mass loss indicates that HDPE hinders the dissolution of the wax mixture and the use of PP could be more beneficial in speeding up the debinding process in n-heptane.
In terms of morphology, it appears that all of the green feedstocks showed excellent dispersions of the particles in the matrix, on the basis of scanning electron microscopy (SEM) assessments. However, PP forms a network of thicker connections between particles, whereas the connections made by HDPE are much thinner and weaker. The debound specimens of PP + SA show large elongated pores in comparison to debound HDPE + SA specimens. This morphology can be explained by the better compatibility of the waxes with HDPE than PP, and could be the reason for the differences in the solvent debinding rate (Fig. 2).
The use of grafted backbones has a significant effect on the adhesion to the powder. As observed in previous studies by this group, grafting helps to create a better connection between the polar surface powder and the backbone, especially when comparing the morphology of the MAgHDPE with that of HDPE + SA. Nevertheless, the size and distribution of pores of the solvent debound specimens are not affected by grafting of the backbone.

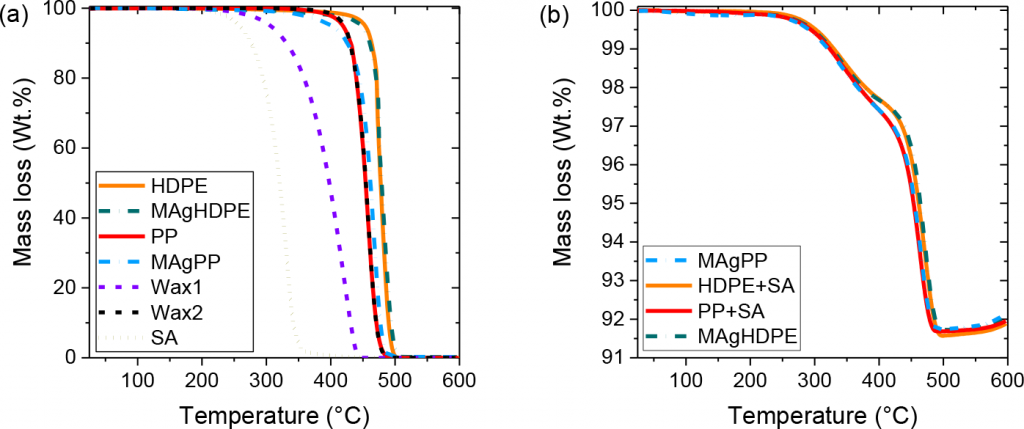
Thermogravimetric analysis (TGA) shows the recorded mass loss over temperature for the binder components and feedstocks (Fig. 3). Stearic acid and one of the waxes decompose at low temperatures, whereas the second wax decomposes at higher temperatures. Due to a similar structure, the PP backbones decompose at similar temperatures to the second wax, but the HDPE-based backbones decompose at higher temperatures. These differences in the backbone decomposition affect the decomposition of the feedstocks. All feedstocks show a first decomposition ramp corresponding to the low molecular weight compounds. However, the second ramp of mass loss starts at a lower temperature for the PP + SA and MAgPP feedstocks than for MAgHDPE and HDPE + SA. Based on these results, the nature of the main backbone chain plays a more critical role in the thermal debinding behaviour than the backbone grafting.
The authors concluded that grafting the backbone improves the adhesion to the powder, especially for HDPE. In general, an improved adhesion to the powder could be used to reduce the amount of backbone in the binder and to optimise the debinding rate. These issues are the subject of ongoing research by the group. However, the effects of backbone grafting on the carbon content and composition of the sintered parts must also be investigated in the follow-up projects.
Accelerated PIM processing by chemical modifications in the binder during the debinding stage
The second paper reviewed was presented by Cristina Berges, Juan Alfonso Naranjo, Macarena Jimenez, Manuel Carmona, Ignacio Garrido and Gemma Herranz (Universidad de Castilla-La Mancha, Spain) and addressed the acceleration of MIM processing by chemical modifications in the binder during the debinding stage [2].
Currently, the most commonly used feedstock in Europe by MIM manufacturers is based on polyacetal (POM) and polyolefin and comprises a catalytic removal of the binder system. The catalytic debinding time is usually in the range 3–10 h, depending on the feedstock material and the component size. Nevertheless, this methodology is not free from experimental issues in the industrial process, and this debinding time might be insufficient with certain geometries.
From both research and industrial points of view, it has been reported that, in order for MIM technology to continue market growth, there is a need to focus on new powder materials (high-temperature intermetallics, particulate composites or controlled porosity) and processing sophistication, so that dimensional control and the process yield can be improved. Also, for environmental reasons, it is highly desirable to develop a faster, cleaner and cheaper debinding process. Efforts to achieve complex shapes at high precision and quality have been focused on optimising sintering time and atmosphere, mould design and feedstock modification for the injection process, moving towards lowering the viscosity and water-soluble binders.
The catalytic debinding process has proven processing and handling advantages, since it allows the manufacture of thicker components than those in thermal debinding. In catalytic debinding, PIM manufacturers typically control the catalyst level within the furnace at up to 4 vol.% of the gas flow, achieving a debinding rate of 1-6 mm/h. Enhancements of this catalytic reaction have been investigated in terms of the optimisation of the experimental set-up conditions. Therefore, by varying the flow rate of the carrier gas, the catalyst and the catalyst level within the furnace debinding zone, the debinding rate can be optimised. Nevertheless, it is important to note that a high purge gas flow rate is needed to increase the debinding rate. Also, no studies have been found in the literature dealing with binder modification of the catalytic feedstock to speed up the PIM process.
In the reported work, chemical additives to the binder have been proposed, with the purpose of reacting with the generated formaldehyde gas and leading to a forced acid-catalysed degradation reaction of the POM component.
The addition of these so-called ‘accelerator’ compounds for formaldehyde capture in the feedstock mixture was expected to mainly cause two effects. On the one hand, favouring the debinding process and increasing the process yield will bring the possibility of manufacturing components with bigger sizes and higher cross-sectional thicknesses or, in the case of thin geometries, becoming a more efficient process reducing the catalyst consumption and energy costs. On the other hand, this process allows the capture of formaldehyde residue, forming a valued product and avoiding its further burning, which is beneficial from an environmental point of view. Chemicals that can act as the trapping molecules of formaldehyde residue are those with a nucleophilic character, such as N-based molecules (polyamines) forming methylol compounds. These materials strongly participate in further polymerisation reactions by means of polycondensation at high temperature.
The most typical accelerator resins are based on melamine or urea compounds. N-based compounds have been selected over O-based compounds, such as phenol, bisphenol A, bisphenol F or derivatives, due to OH functional groups showing less nucleophilic character than nitrogen-based ones. However, it is important to consider the gas atmosphere composition generated after the thermal degradation of the binder, since it can affect the green and sintered components.
In this reported work, initially, with the aim of enhancing the debinding rate, the accelerator concentration and the acid concentration with respect to the POM and inert gas flow, respectively, were to be determined. Also, the acid type to be employed in this study was to be selected. Although nitric acid is typically used in industrial catalytic debinding, the acid gas atmosphere for this preliminary study was required to show thermal stability and to allow working in batches. In this context, the most suitable experimental conditions to produce the catalysed POM degradation followed by the polymerisation reaction of Melamine-Formaldehyde (MF) resins were to be investigated. Once the isolated system was characterised, the process would be applied to the real MIM feedstocks widely used in industry (316L, 17-4PH stainless steels or FeNi alloys) using chemical reactors based on industrial conditions, in a future second phase of the study.
The POM employed in the reported study was a commercial grade powder without any additives, typically used as the polyacetal component of catalytic MIM feedstocks. This was a homopolymer type with a melt flow index of 15 g/10 min. Melamine was selected as the N-based molecule to produce the Melamine-Formaldehyde (MF) resin by a polycondensation reaction. Oxalic acid 2-hydrate was employed to ensure the acidic conditions that catalyse the chemical reactions, involving simultaneous POM degradation and MF resin production.
To establish the experimental conditions at the laboratory scale, oxalic acid 2-hydrate was thermally characterised by TGA and DSC analysis, as shown in Fig. 4. The TGA thermogram, performed under nitrogen atmosphere with a heating ramp at 5°C/min to 700°C and cooling ramp at 25°C/min to room temperature, showed a weight loss up to 100°C, corresponding to water molecule vapourisation, and a second weight loss below 200°C, corresponding to acid vapourisation. Additionally, the DSC thermogram, performed with a heating ramp at 5°C/min to 250°C, showing several endothermal peaks, which corresponded to water vapourisation at 100°C, acid sublimation below 150°C and a degradation peak in a higher temperature range. Also, the insert graph in Fig. 4b showed the heat flow change during the 30 min isotherm at 120°C (from time = 20 min).
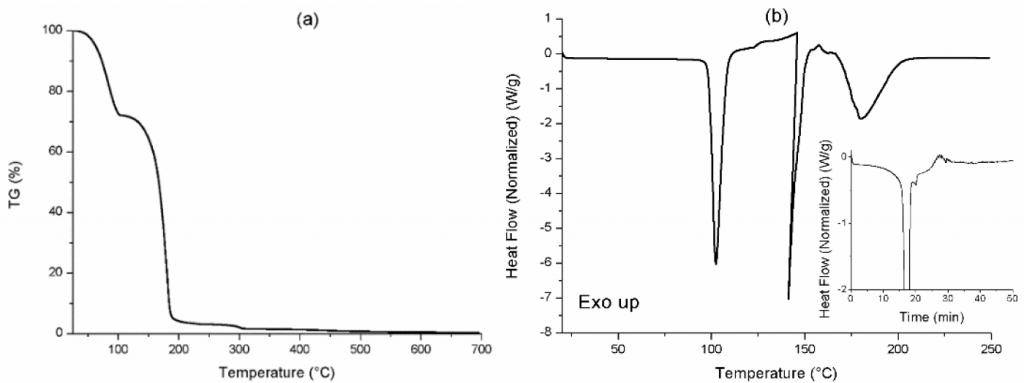
In contrast to industrial catalytic debinding, which uses the catalyst in vapour form, being transported to the sintering furnace by means of an inert carrier gas, the in-situ generation of the catalyst required a temperature that favoured catalyst vapourisation from its solid form. In this case, a vapourisation temperature of 120°C was considered for comparison with that used in the industrial process, where nitric acid is traditionally employed. In a first approach, POM degradation was analysed by considering a closed furnace without carrier gas and no catalyst losses, for favouring the formaldehyde trapping. For this purpose, the vapourisation flux of the oxalic acid occurring at 120°C for 30 min was also calculated by DSC in the range 20-26 min (Fig. 4b, inset), estimating the power required for vapour formation at 120°C and the vapourisation enthalpy. Evidently, by observing the vapourisation of the oxalic acid, the amount of catalyst evaporated can be increased with increasing temperature, increasing the debinding rate but reducing the economic feasibility of the process. By this assessment, the optimum temperature can be defined.
The mixtures of POM, melamine and oxalic acid firstly underwent the reactions defined by DSC using hermetic high-volume pans, so that the gas atmosphere (catalyst and released formaldehyde) produced during the reaction time could be maintained and the MF resin formation could take place. The following thermal cycle was employed: ramp at 5°C/min to 120°C (hold 240 min), followed by a cooling ramp at 25°C/min. The reaction time, established as 240 min, was high enough to ensure the occurrence of the polymerisation reaction. The products obtained from the previous reactions were characterised by TGA analysis under nitrogen atmosphere at the following conditions: heating from 25 to 700°C at a ramp of 5°C/min, followed by a cooling ramp of 25°C/min from 700 to 25°C.
The structures of the MF resins vary significantly with the reaction conditions (molar ratios of the reactants, pH, time, catalyst and temperature). Therefore, in this study, different mixtures of POM and melamine were prepared, corresponding to a varied concentration of melamine/formaldehyde (M/F) molar ratios, as indicated in Table 3.
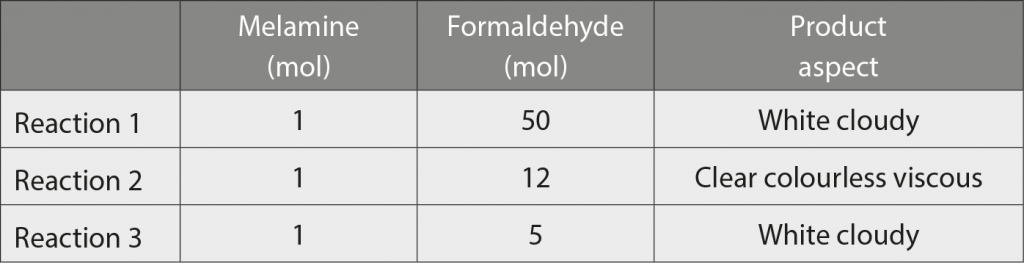
The stoichiometric molar ratio in MF resins is 1:6, so the concentrations employed were selected to study different situations, trying to force the capture of the released formaldehyde: (i) a high excess of formaldehyde (M/ F=1/50) – Reaction 1, (ii) a moderate excess of formaldehyde (M/F=1/12) – Reaction 2 and (iii) a moderate excess of melamine (M/F=1/5) Reaction 3 in Table 3.
Regarding the in-situ generation of the catalyst using oxalic acid in the reactions, the vapourisation flux of the acid at 120°C was used to determine that only 7.58% of the oxalic acid underwent the vapourisation process. Despite this low amount of vapourisation, results have suggested that several reactions occur, on employing this acid at 120°C during the DSC experiments.
Before describing the TGA results for reactions 1–3 (Fig. 6), the TGA analysis of the four reference products (POM, POM + oxalic acid, melamine and M/F=1/6 under basic pH conditions) can be seen in Fig. 5.

The mixture of POM with oxalic acid showed a fast degradation rate below 200°C, compared with the POM degradation, demonstrating that this acid is able to decompose the polymer even at low temperature; the melamine reactant is thermally decomposed at higher temperature (300°C); and the conventional MF resin from a M/F molar ratio 1/6 shows a significant weight loss around 400°C. In Fig. 6a, the TGA curve evolution gives evidence of MF resin formation in all cases and the residual weights of the samples corresponding to reactions 1–3 are approximately 0.0, 3.7 and 1.2%, respectively. Also, the lowest M/F molar ratio gave the highest degradation rate compared with the other two MF resins, indicating a lower MF resin formation yield. Furthermore, the TGA derived curves of the samples, in which the maximum value of the different peaks could be determined, are reported in Fig. 6b. These results provide information regarding the curing mechanism and the MF resin structure obtained in each case.
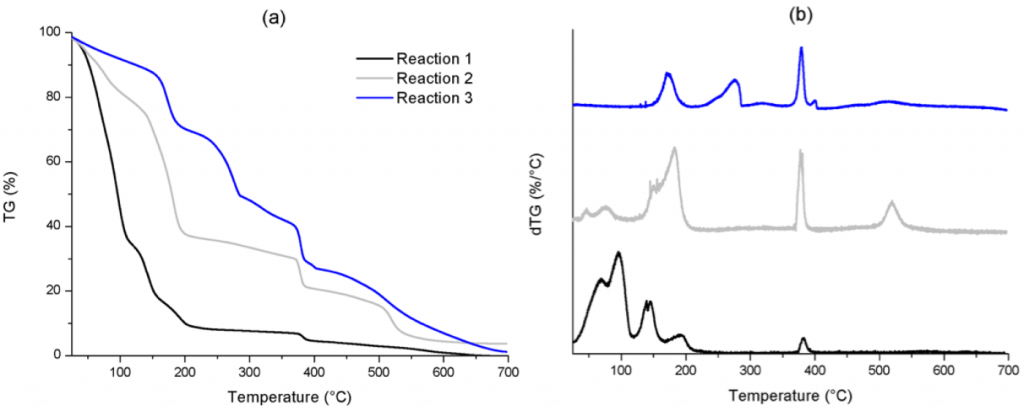
The major weight losses in Reaction 1 were observed in the temperature range from 25 to 210°C (Fig. 6a), corresponding to 90.5% of the total mass and associated with water vapourisation, the released formaldehyde and oxalic acid residue. The water vapourisation is related to the thermal curing process, by means of two processes: self-condensation of methylol compounds, leading to ether bridge formation, and condensation between melamine and methylol groups, leading to methylene bridges. In the second temperature range, from 210 to 390°C, the weight loss (only 4.2%) was associated with the elimination of formaldehyde from ether bridges, forming methylene bridges followed by the breakdown of methylene groups of the MF resin, in accordance with the small peak determined in Fig. 6b at 380°C. The final temperature range above 390°C can be related to the thermal degradation of triazine ring and the formation of HCN, CO2 and CO. In this range, only 4.8 wt.% is decomposed and the final residual weight is nearly 0.0%, meaning that very little MF resin was obtained using a high excess of formaldehyde.
In Reaction 2, weight losses were observed in temperature ranges from 25 to 200°C, 200 to 385°C and at temperatures higher than 385°C. In the first temperature range, several weight losses were detected, attributed to water vapourisation, non-reacted formaldehyde thermal degradation and oxalic acid residue, but these were lower than in the case of Reaction 1, 62.3% and 90.5%, respectively. Compared with Reaction 1, the peak at 380°C, corresponding to the main structural decomposition of methylene-MF resins, was more relevant, when the formaldehyde excess is moderate, as can be seen in Fig. 6b. Also, an intense peak at 520°C and a related 17.8% weight loss can be noted, that can be attributed to a branched structure, in which methylene bridges dominate. This result may correspond to a high molecular weight and narrow distribution product but with low crosslinking, since the moderate excess of formaldehyde favours the chain growth of the resin.
Finally, Reaction 3 showed the lowest weight loss of the TGA signal from 25 to 200°C (29.5% in contrast to 90.5% and 62.3% for Reactions 1 and 2, respectively). Also, only one peak was determined in this range, at 170°C (Fig. 6b), which may be attributed to oxalic acid residue. The second temperature range of weight losses was determined as 200–400°C, composed of two degradation regions with a total mass degradation of 43.3%. The first peak, determined at 275°C in Fig. 6b, corresponded to 21% weight loss and may be related to non-reacted melamine, due to the molar ratio employed in this case (total concentration of melamine corresponds to 35.8 wt.% in Reaction 3). Also, the further weight losses around 400°C showed a main peak at 380°C, together with a small peak at 400°C (Fig. 6b). These were related to the methylene bridge breakdown of the varied MF structures formed. The highest temperature range above 400°C corresponded to the highest weight loss (25.8%). However, no peak was noticeable in this range, in contrast to Reaction 2. This means that high thermostable products were present with a broad molecular weight distribution, when a moderate excess of melamine is used, due to a high degree of crosslinking. In summary, the lower presence of formaldehyde in the reaction enhances the crosslinking process in the resins and the formation of more thermostable products.
On the basis of these results, it could be concluded that a M/F molar ratio between 1/5 and 1/12 could be defined as the most suitable to increase the MF resin formation.
Overall, the authors have concluded that it is possible to affirm that, by changing the debinding temperature, it is possible to modify POM degradation and, therefore, the MF formation. All of this information will be subsequently applied to the study of the POM debinding rate in ongoing research. This project will also be enriching, from a scientific point of view, in investigating the influence of accelerator chemical structure on the decomposition sub-products obtained and analysing possible changes in the composition of emitted gases. What is clear is that such chemical modifications of the POM-based binder are suggested in order to further increase the debinding rate and, thus, the efficiency of MIM technology.
Unraveling the homogeneity of MIM
The final paper reviewed was based on the recognition that defects in MIM parts are often not detectable until after sintering and that, therefore, much could be gained from the availability of analytical methods able to enhance understanding of the homogeneity of MIM feedstocks and green parts at an earlier stage in the process chain. This paper was presented by Sherif Madkour, Ingolf Hennig, Wieland Koban and Marie-Claire Hermant (BASF SE, Germany) [3].
The method presented by these authors considered the system under investigation as a binary system with metal/conductive fillers and binder/polymer. Also, it assumed that the homogeneity of a binary (polymer/filler) highly filled suspension is a function of two types of mixing: dispersive mixing and distributive mixing. On the one hand, good dispersive mixing means a smaller agglomerate size. Consequently, measuring the surface area of the metal agglomerates within the polymer matrix would be an accurate estimate of the quality of dispersive mixing. This could be achieved in a semi-quantitative manner utilising dielectric spectroscopy and/or quantitatively using BET N2-sorption. On the other hand, the quality of distributive mixing could be estimated by determining the interparticle distance; the better the former, the lower the latter; where interparticle distance > 0. Volume Intrusion Mercury (Hg) porosimetry was the characterisation method selected for this task.
BASF’s Catamold® 8620 was used as the system under investigation for this reported work. All samples used had the same recipes and identical metal powder loading. The presented measurements were focused on studying the homogeneity of the feedstock. It is well known that the compounding process is a major player in the feedstock’s homogeneity quality. Therefore, only the compounding process was changed and all other post-processes (injection moulding, debinding and sintering) and their processing parameters were kept constant.
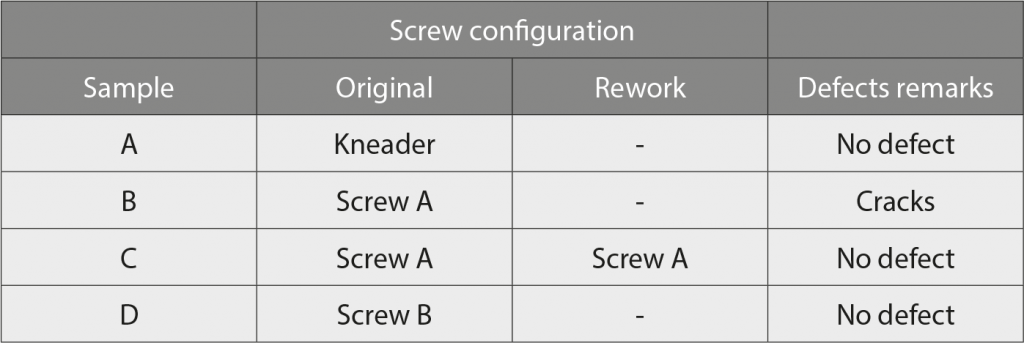
To produce a sample with different homogeneities, four different sets of feedstock samples were produced and tested.
- Sample A: Feedstock produced on kneader
- Feedstock from the twin-screw extruder (TSE) utilising screw configuration A
- Reworked feedstock on the TSE with screw configuration A
- Feedstock from TSE utilising screw configuration B, which had tailored dispersive and distributive mixing through precise shear application with guidance from the analytical results
Despite the identical recipe and post-processing conditions, kneaded feedstock showed no defects, whereas the extruded feedstock with screw A showed cracks in the sintered part. This led to the conclusion that different homogeneities could result in such defects. A summary of all samples used is given in Table 4.
In dielectric spectroscopy, an AC electric field is applied to the dielectric material under investigation. The material is polarised due to the fact that the permanent dipoles and the induced dipoles try to orient themselves along the applied E field. This yields a dielectric relaxation behaviour that is described by the so-called complex dielectric function ε*(f) = ε′(f) − iε″(f), where ε′ and ε″ are the real and imaginary (loss) parts of the complex dielectric function. Here, f denotes the frequency and i is the imaginary unit.
Dipolar relaxation processes are characterised by their relaxation time, where the corresponding relaxation process shows a step in ε′(f) and a maximum in ε″(f). For polymers, the relevant relaxation processes are named α-, β- and ɣ- relaxations. Below the relaxation frequency, the dipoles can follow the applied E field, whereas, at higher frequencies, they cannot. However, in the range 60-90 GHz, there should no longer be any dipolar relaxation process, only electronic polarisation processes can still contribute to ε′ and yield an ε′ (electronic polarisation) in the range of 2–2.5. There is no dielectric loss contribution coming from electronic polarisation, meaning that ε’’ (electronic polarisation) = 0.
There is another interesting polarisation phenomenon arising in this range, namely Maxwell-Wagner-Sillars polarisation (also called interfacial polarisation). In a heterogeneous system (e.g., polymeric system filled with metal particles), such interfacial polarisation takes place due to the huge difference in electrical conductivity between polymer (insulating) and metal particle (metallic conductivity). The electrons of the metal fillers are blocked at the interface to the polymer. The counter-charge at the interface is created due to the electronic polarisation of the polymer. Thus, the induced interface dipoles result in the interfacial polarisation of the system, see Fig. 7. Since this polarisation takes place only at the polymer/filler interface and in a frequency range where the interfacial polarisation is the dominant process, analysing the corresponding complex permittivity function; ε′ and ε″, should give deep insights into the state of the available conductive surface area in contact with the polymer.
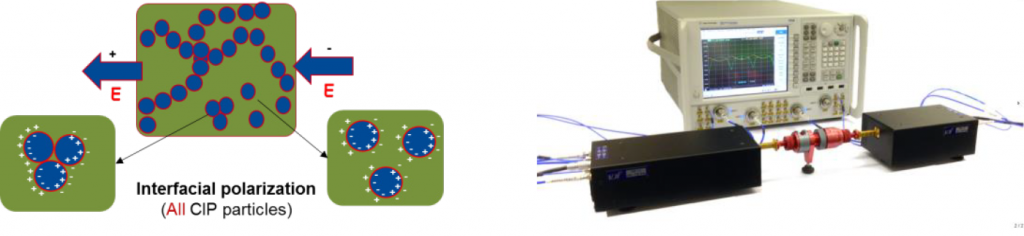
The dielectric measurements in the microwave range (60–90 GHz) were carried out with a corrugated waveguide, as a sample holder. The S parameters (which refer to the scattering matrix of a microwave network): S11 (reflection) and S21 (transmission) were measured via the network analyser with wave extenders for each frequency. From these parameters, the dielectric parameters ε′ and ε″ can be calculated. All measurements were done at room temperature.
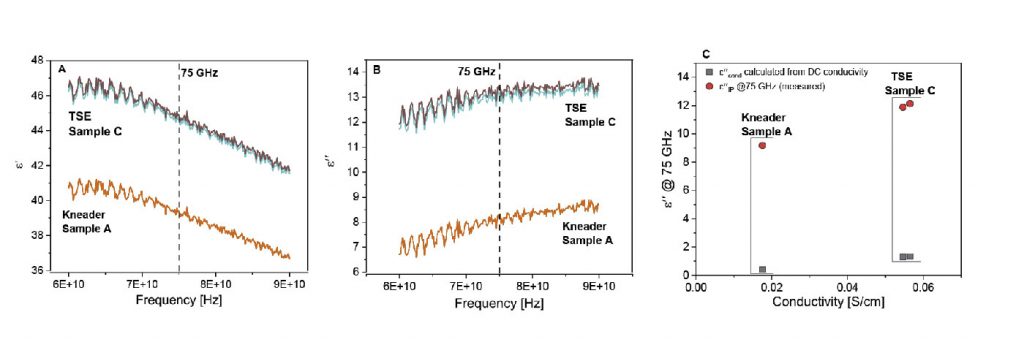
From the measured S-parameters, the dielectric parameters ε′ and ε″ of the sample material were calculated at each frequency point, using the swissto12 materials measurement software, which uses well-known equations for the reflection and transmission coefficient for a plane wave impinging vertically onto a flat sample with thickness d, to calculate S11 calc (ε′, ε″,d) and S21 calc (ε′, ε″,d). In addition, it uses a least squares optimisation to find the values of ε′ and ε″ until the difference between measured and calculated S11 (S21) is minimal. Fig. 8 shows an example of a dataset for different materials.
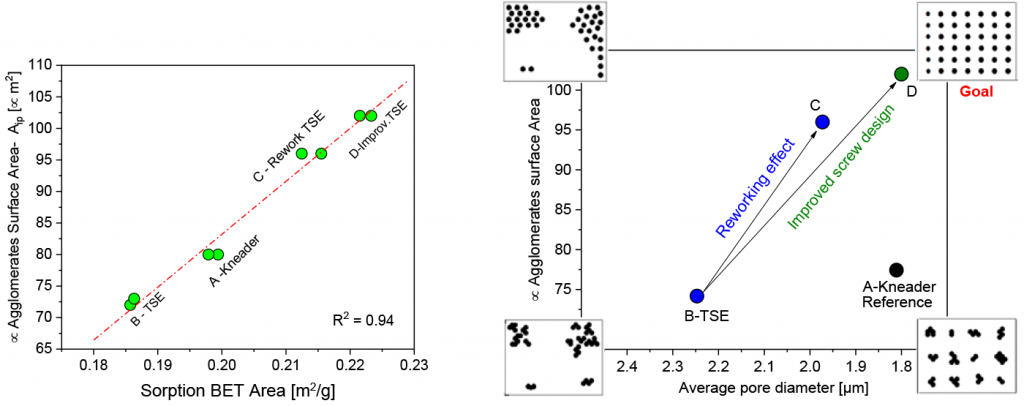
To confirm that the calculated surface area of the agglomerates does indeed reflect the measured value, the BET area is plotted against the calculated number proportional to the surface area (Aip) measured from dielectric spectroscopy (given in Fig. 9a). Fig. 9 reflects a strong linear proportionality with R2 =0.94, confirming this assumption.
Hg- Porosimetry is a method of structure analysis, where pore diameters in the 0.001 µm – 430 µm range can be measured. With mercury porosimetry, pore information is obtained by forcing liquid mercury into these pores by increasing the external pressure. As the pressure is incrementally increased, the amount of mercury required to fill the pores is recorded. This information, as well as information concerning the contact angle, is used to calculate the pore structures using the Washburn equation. Pore area, pore volume, bulk density and porosity values could all be measured or calculated. Measuring the pore size distribution of debound granulates and brown parts serves as a good tool to quantify the quality of the binder distribution and thus the quality of the distributive mixing. By measuring both debound granulates and brown parts, conclusive insights into the effect of TSE, kneader, and injection moulding on distributive mixing could be made. Fig. 10a depicts a typical set of data presented as log differential intrusion as a function of pore size diameter.

The porosimetry results for Catamold have shown that the pore size distribution of Catamold has three main regions, each revealing new insights into its structure. The three different regions, as illustrated in Fig. 10a, are:
- Region I. Pores mainly due to air bubbles formed during compounding, see Fig. 10b and its inset. These bubbles are normally completely degassed during injection moulding
- Region II. Polymer domains imprint, which gives the most important insights into the distributive mixing
- Region III. Shrinkage gaps due to POM’s strong crystallinity/shrinkage behaviour, which only appears in the green part and feedstock and not in the brown state
Region II is the most relevant and important range in the porosity measurements. It normally extends between around 10 µm – 0.5 µm and dominates over 95% of the total intrusion volume, in debound feedstocks and brown parts. However, for feedstock and green parts (non-porous sample geometry with the binder, thus measuring only the surface porosity), no peaks are observed in this region. Therefore, region II is assigned to the binder imprint. Consequently, the average pore size diameter in region II is the interparticle distance in the 3D network and defines the quality of the distributive mixing in the feedstocks (TSE or kneader effect) and parts (injection moulding effect). Fig. 10c shows the results of all samples measured as well as the reproducibility measurement for each sample.
Having now shown that the surface area of the agglomerates (Fig. 9a), as well as the interparticle distance (Fig. 10c), could be quantitatively measured, the next step was to assemble all the measured information, in order to assess the homogeneity quality of the samples of Catamold 8620.
Fig. 9b shows the proposed representation to assess the overall homogeneity quality in the so-called homogeneity map. The X-axis presents information on average interparticle distance (average pore size diameter) and the Y-axis presents information on the size of the agglomerates (interfacial polarisation surface area). To achieve optimum homogeneity requires the lowest possible interparticle distance, with the highest possible surface area.
Fig. 9b shows that sample B (TSE) has worse distributive and dispersive mixing, compared with the kneaded sample. However, by reworking the feedstock in the TSE, sample C, both dispersive and distributive mixing were significantly improved. Though the reworked sample has better dispersive mixing, even compared to the kneaded materials, it still slightly lags in terms of distributive mixing. In the light of the new insight delivered by this study, screw B was designed to improve distributive mixing quality, by carefully adding mixing elements to the screw configuration. Sample D (TSE-with improved screw design) depicts the superior homogeneity quality, as compared with samples A and C. This indicates the potential for using a TSE for compounding MIM feedstocks.
These results were in good agreement with defect observations on sintered parts, where sample A, C and D, were found to be defect-free. Consequently, distributive mixing could probably be one crucial parameter in avoiding cracks in the final parts.
Overall, the authors concluded that the developed method could prove to be a powerful tool, sensitive enough to detect small differences in overall homogeneity and giving new insights into feedstocks and green part quality. More importantly, this could be used as guidance for compounding process design to ensure high-quality feedstocks for reliable MIM part production.
Author and contacts
Dr David Whittaker
Tel: +44 1902 338498
[email protected]
[1] Christian Kukla, Montanuniversitaet Leoben
[email protected]
[2] Cristina Berges, Universidad de Castilla-La Mancha
[email protected]
[3] Sherif Madkour, BASF SE
[email protected]
References
[1] Effect of backbone selection on the solvent debinding of metal injection moulding feedstocks, Kukla C., Cano S., Schuschnigg S., Holzer C., Gonzalez-Gutierrez J. As presented at the Euro PM2021 Virtual Congress, October 18-22 2021, and published in the proceedings by the European Powder Metallurgy Association (EPMA)
[2] Accelerated PIM processing by chemical modifications in the binder during the debinding stage, Cristina Berges, Juan Alfonso Naranjo, Macarena Jimenez, Manuel Carmona, Ignacio Garrido, Gemma Herranz. As presented at the Euro PM2021 Virtual Congress, October 18-22 2021, and published in the proceedings by the European Powder Metallurgy Association (EPMA)
[3] Unraveling the Homogeneity of MIM, Sherif Madkour, Ingolf Hennig, Wieland Koban, Marie-Claire Hermant. As presented at the Euro PM2021 Virtual Congress, October 18-22 2021, and published in the proceedings by the European Powder Metallurgy Association (EPMA)