


Binder Jetting of a dual-phase steel: Process insight and optimisation using the Master Sintering Curve
Binder Jetting (BJT) is never far from the headlines in the worlds of Powder Metallurgy and Additive Manufacturing, but, whilst there has been a lot of emphasis on Binder Jetting’s build process, the crucial sintering stage has received less attention. Can we really go along with the assumption that it’s ‘just like sintering for Metal Injection Moulding’? Here, Markus Schneider and colleagues from GKN Sinter Metals Engineering GmbH, GKN Additive and Hoeganaes Corporation bring together their deep expertise in sintering to reveal just how differently metal BJT parts perform, and what implications there are for part design and future process optimisation. [First published in PIM International Vol. 16 No. 3, September 2022 | 25 minute read | View on Issuu | Download PDF]
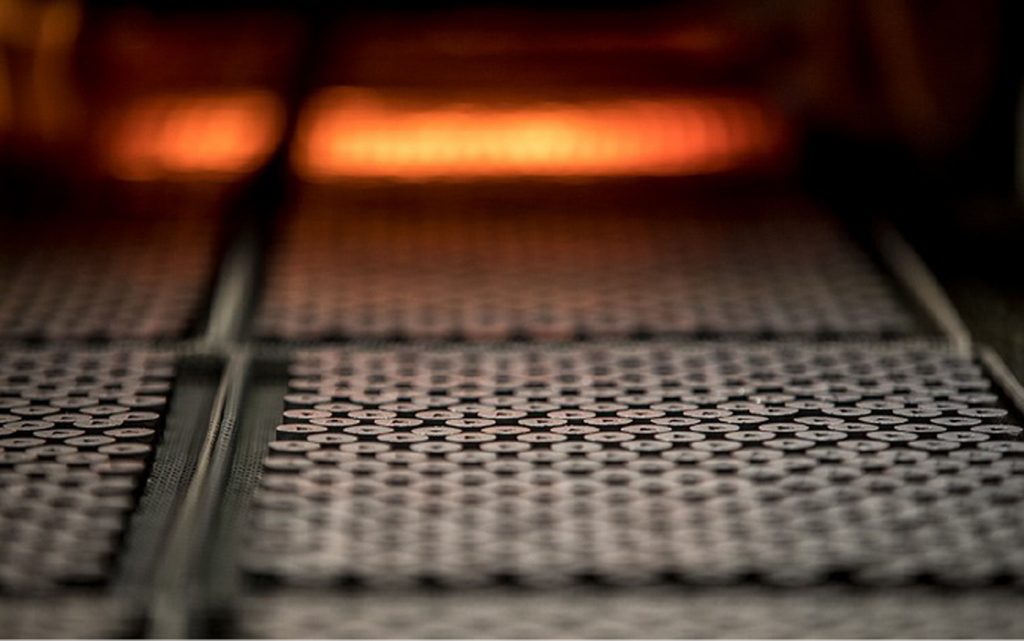
The Master Sintering Curve (MSC) is a useful tool to compare different sintering profiles regarding their effect on material shrinkage, especially for fine powders. This is reached by the stepwise contraction of sintering temperature and sintering time to a common sintering parameter, and its sigmoidal correlation to the densification parameter as a measure of the sintering response. The underlying sintering kinetics are investigated in terms of the process’s activation energy. Similar to Metal Injection Moulding, metal Binder Jetting is a two-stage Additive Manufacturing process, whose sintering behaviour is characterised by the significant material shrinkage that takes place before the components’ final geometry and density is reached. Fig. 1 shows parts entering an industrial-scale continuous sintering furnace.
In this study, a newly developed dual-phase steel, which can be tailored for a variety of strength/ductility combinations, is characterised by dilatometric sintering trials and a subsequently generated Master Sintering Curve. The findings presented suggest that, due to ‘textures’ introduced by the layer-by-layer BJT process, the resulting material shrinkage exhibits an anisotropic behaviour, which must be carefully considered.
Compared with laser-based Additive Manufacturing processes – in particular Laser Beam Powder Bed Fusion (PBF-LB) – metal Binder Jetting is more energy-efficient when it comes to industrial production volumes. However, whilst it has similarities to Metal Injection Moulding, there are still a few hurdles which hinder its wider application:
Component size
The maximum size (dead weight) of the component is limited to prevent sinking/sagging due to insufficient support from the surrounding powder bed.
Surface finish
Final surface roughness Ra and Rz depend on the layer thickness x and the (typically manual) depowdering strategy and process as a whole.
Shrinkage characteristics
Inhomogeneous and anisotropic volumetric shrinkage exists ε3D due to an initial powder, binder and layer distribution that is not fully isotropic, as well as temperature distribution variations within the sintering furnace, within the component and between components on the sintering tray.
Creep effects
Superimposed creep effects can lead to further deformations.
Material availability
Limited materials are available which are of interest to the automotive and machinery industries.

Overview of sintering profile development
Sintering and creep are two related phenomena occurring in similar temperature ranges T (homologue Tammann temperature TD≈0.4Tm for pure metals and TD≈0.6Tm for alloys) and with similar activation energies (Qs≈Qc). This observation is based on one of Professor Gustav Tammann’s favourite experiments: the stirrer experiment in which a stirrer with a minimum of torque whisked through a heated metal powder column. The temperature T when the stirrer stopped due to an increased friction (the start of sintering) was recorded and normalised to the metal powders melting temperature Tm. In general, sintering is related more to the volumetric change of a component under the influence of the applied hydrostatic stress σH (resistance against sintering: bulk viscosity K), whereas creep affects the geometric shape of a component under the influence of the deviatoric stress ε’ij (resistance against creep: shear viscosity G).
However, in continuum mechanical sintering modelling, both effects are incorporated into the commonly used material law ε’ij=σ’ij/2G+δij(σH-σs)/3K. Thus, the strain rate ε’ij (total deformation) is the weighted sum of both terms. The weighting depends on the porosity f present and the applied stress σ [1, 2].
Prior to the application of the Master Sintering Curve, it is worth reconsidering the other existing sintering parameters, which combine the sintering time t and the sintering temperature T into a single parameter to characterise the intensity of the sintering and the corresponding resultant material quality. This approach is not new; there has always been an effort to predict the sintered density ρ from the sintering profile T(t), because most material properties exhibit quite a good correlation.
Professor Paul Beiss adopted the Larson-Miller parameter PLM from creep mechanics (for example, to accelerate the time-consuming creep experiments by using higher temperature levels) to differentiate High Temperature Sintering (HTS) treatments from conventional sintering runs. Due to the previously mentioned similarities between sintering and creep, this idea is straightforward. A more detailed view on the derivation of the Larson-Miller parameter PLM notes its relation to the Monkman-Grant creep law and the Arrhenius activation equation.
The Larson-Miller parameter PLM is defined as:
PLM=T(log(t)+20)
By introducing the reference time of t0=1 h into this equation, the inconsistency of the unit can be avoided, and the resulting unit of the Larson-Miller parameter PLM is Kelvin:
PLM=T(log(t/t0)+20)
The same, or a very similar parameter, can also be found in the heat-treating community. The Hollomon-Jaffe parameter PHJ is commonly used to define tempering time t and tempering temperature T and for the derivation of Master Tempering Diagrams (correlation between the Hollomon-Jaffe parameter PHJ and the hardness H), as:
PHJ=PLM/1000
However, all definitions can only deal with rectangular (isothermal) sintering profiles T(t). This disadvantage is solved by the adoption of sintering work θ(t, T) in the MSC, which is more flexible and can incorporate the contribution of the heating and cooling phases. Another commonly used sintering parameter is the penetration depth x of an atom into the crystallographic host lattice as a metric for the intensity of the diffusion:
x=2(Dt)0.5
The penetration depth x is often used to characterise the response of thermochemical surface treatments like case hardening (interstitial carbon diffusion) or nitriding (interstitial nitrogen diffusion). The equation tells us that a fourfold time is needed to double the case hardening depth x=CHD or nitriding hardness depth x=NHD. The diffusion coefficient D is temperature-dependent and is linked to the Arrhenius activation equation as:
Di=D0, i exp(-Qi/RT)
This equation is the basis for the Arrhenius plot and the kinetic field approach. The penetration depth x is a function of the transient concentration distribution C(x, t) described over the Gaussian error function (2nd Fick’s law of diffusion) as:
C(x, t)=C∞-(C∞-C0)erf(x/(2(Dt)0.5)
This equation describes the concentration distribution C(x, t) from the surface concentration C∞ to initial concentration C0 as a function of time t. For x=2(Dt)0.5, the function within the bracket becomes unity and the Gaussian error function becomes erf(1)=0.8427. This means that, at the coordinate of x, there is a concentration gain of approx. 16% (1-0.8427=15.73%). The exact value is irrelevant. The penetration depth x has the same disadvantage as the Larson-Miller parameter PLM (dealing with rectangular (isothermal) sintering profiles T(t) only).
The main problem in these sintering parameters is their link to the microscopic evolution of the sintering response. The use of coarse powders and/or a low homologue Tammann temperature TD will suppress volumetric shrinkage ε3D because the system will remain in the initial sintering stage I. Consequently, only indirect metrics for the sintering response and progress – for example, mechanical, electrical or thermal properties – can be used for their correlation with any of the sintering parameters, with all their drawbacks (the mechanical properties are more affected by the cooling rate ΔT/Δt after sintering).
Sintering neck formation and the resulting phase transformations can be monitored in laboratory sintering experiments (sphere/sphere, sphere/plate, cylinder/plate configurations, etc), but is not possible using real powders. This limits this methodology to material systems which undergo the intermediate sintering stage II and the final sintering stage III, because the volumetric shrinkage ε3D is a direct metric for the sintering response.
FSLA dual-phase steel
A newly developed dual-phase Free Sintering Low Alloy (FSLA) steel was used and further characterised by dilatometric sintering trials on binder jetted materials. FSLA is a gas atomised Fe + 0.20% Mn + 1.60% Cr + 1.45% Mo + 1.54% Si + 0.15% C alloy with a high degree of sinterability, which offers a wide range of strength/ductility combinations. The composition was modified in such a way that sintering takes place in the body-centred cubic (bcc) crystallographic lattice structure rather than in the face-centred cubic (fcc) crystallographic lattice structure. The more open bcc crystallographic lattice structure exhibits higher self-diffusion coefficients.
Its dual-phase (martensite-ferrite) microstructure with precipitated carbides results in a characteristic ultimate tensile strength (UTS) of σu=600 MPa, very similar to the DP600 dual-phase material class. The martensitic phase is responsible for strength, whereas the low carbon ferrite offers ductility. Depending on the heat treatment schedule, the yield strength can be varied between σ0.2=379 MPa and σ0.2=481 MPa and the ultimate tensile strength can be varied between σu=650 MPa and σu=959 MPa.
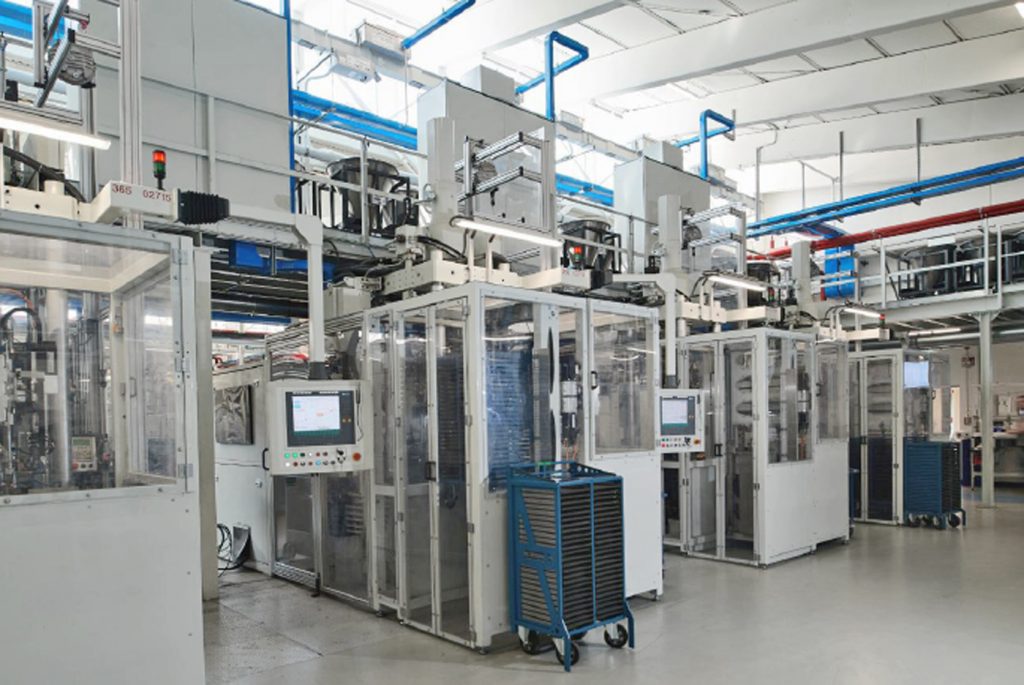
The gas atomised FSLA material has a typical particle size of d10≈6 μm, d50≈15 μm and d90≈27 μm [3]. Cylindrical green specimens were built in X- (binder jet nozzle movement direction), Y- (recoater movement direction) and Z-direction (gravity direction), with a height of h≈7 mm and a diameter of d≈5 mm, using a layer thickness of x=70 μm on an HP Metal Jet BJT machine (Fig. 2). The resulting green densities ρg can be found in Table 2.
Dilatometry
Dilatometric sintering runs are small-scale sintering experiments and deliver the raw data for the Master Sintering Curve. Thermodilatometric Analysis (TDA) is a special case of Thermomechanical Analysis (TMA) with negligible loads (TDA is often called ‘zero force TMA’); both methods belong to the Thermal Analysis (TA) family [4,5].
There are two kinds of dilatometer available on the market. Pushrod dilatometers record only the linear axial shrinkage (εaxial). Their accuracy depends on the shape of the cylindrical specimen used (tilting of non-perfect cylinders during gripping with the pushrod). Friction is minimised in horizontal pushrod dilatometers by a line contact between the lateral specimen surface and the surrounding gripping unit. An axial contact force (Faxial) maintains the contact to the pushrod [4,5].
Optical dilatometers record the linear axial shrinkage (εaxial) and the linear lateral shrinkage (εlateral) in a simultaneous manner. The beauty of this Thermal Optical Measurement (TOM) is that the sintering process can be observed in-situ [6]. The accuracy is not affected by tilting, but the optical signals must be filtered several times due to flickering of the hot protective gas inside the optical dilatometer and a subsequent video image analysis is needed. Since there is no pushrod, there is no possible falsification of the linear axial shrinkage (εaxial) from the applied axial contact force (Faxial). However, the investment costs for an optical dilatometer are far higher than the costs for a pushrod dilatometer.

The corresponding (final) sintered density (ρs) is calculated in both cases (the negative sign is dropped in this formulation) as ρs=ρg/(1-(ΔL/L0))3. In this equation, ρg denotes the green density, whereas the linear axial shrinkage is calculated as εaxial=ΔL/L0. For a better comparison of materials having different green densities ρg, theoretical densities ρ0 and (final) sintered densities ρs a further manipulation is needed. The dimensionless densification parameter ψ (defined between 0 and 1) is defined as ψ=(ρs-ρg)/(ρ0-ρg). The numerator (ρs-ρg) is a metric for the achieved densification and the denominator (ρ0-ρg) defines the possible densification. However, in the case of pushrod dilatometers, isotropic shrinkage (εaxial=εlateral) must be assumed. A problem will arise if the volumetric shrinkage (ε3D=ΔV/V0) is anisotropic since information regarding the linear lateral shrinkage (εlateral=ΔD/D0) cannot be derived from conventional pushrod dilatometers.
Laboratory dilatometric sintering runs differ from industrial sintering runs due to the low thermal inertia of the cylindrical specimen used and the high heat transfer. Moreover, the heating rate (ΔT/Δt) can be defined and controlled in a narrow range. Two thermocouples are used for the control, whereas one thermocouple is located as close as possible beside the cylindrical specimen. The main benefit of this TA is that the linear axial shrinkage (εaxial) is recorded in a continuous manner. Therefore, the evolution of the linear axial shrinkage (εaxial) as a function T(t) of the chosen sintering profile can be followed in detail. Nevertheless, the goal is the transferability (adjusting the industrial sintering parameters based on the results from the dilatometric sintering runs).
For this study, the linear axial shrinkage (εaxial) of FSLA was measured with a pushrod dilatometer. The displacement (ΔL) is measured over the induction current via a linear variable differential transformer (LVDT). Since the dilatometry signal is superimposed on the thermal expansion of the pushrod and the cylindrical specimen, two corrections are needed. The thermal expansion of the pushrod is compensated by a ‘dummy’ dilatometric sintering run without a cylindrical specimen, while the thermal expansion of the cylindrical specimen is compensated by a correction term (CTE=1010-6 K-1). The chosen coefficient of thermal expansion of CTE=1010-6 K-1 is very close to the Grüneisen rule estimation of CTE≈0.02/Tm [7]. That rule assumes a constant axial linear thermal expansion of εaxial, thermal=2% in the melting temperature range Tm. FSLA exhibits a melting temperature of Tm≈1666.15 K. The current dilatometric sintering runs were conducted at Linseis in Selb with a Linseis L 75 PT dilatometer (horizontal single pushrod). An axial contact force of Faxial=250 mN was applied during the measurement to maintain the contact between the sample and the pushrod.

The effect from that axial contact force (Faxial) is negligible. For very accurate measurements, several measurements with different axial contact forces (Faxial) can be applied. Afterwards, the data points can be extrapolated to an axial contact force of Faxial=0 N. Pure hydrogen (100% H2 with a flow of ΔV/Δt=10 l/h) was used as the sintering atmosphere. Fig. 3 and Table 1 define the applied sintering profiles.

Two different heating rates (ΔT/Δt) were chosen to identify potential dependencies. It is known within the Field-Assisted Sintering Techniques (FAST) that, at very high heating rates (ΔT/Δt) the densification can be enhanced by a suppressed grain coarsening. This effect is called ‘fast firing’ and depends on the corresponding activation energies for sintering Qs and grain coarsening Qg [8, 9]. However, the relevant heating rates (ΔT/Δt) for FAST are orders of magnitude higher than the applied ones.
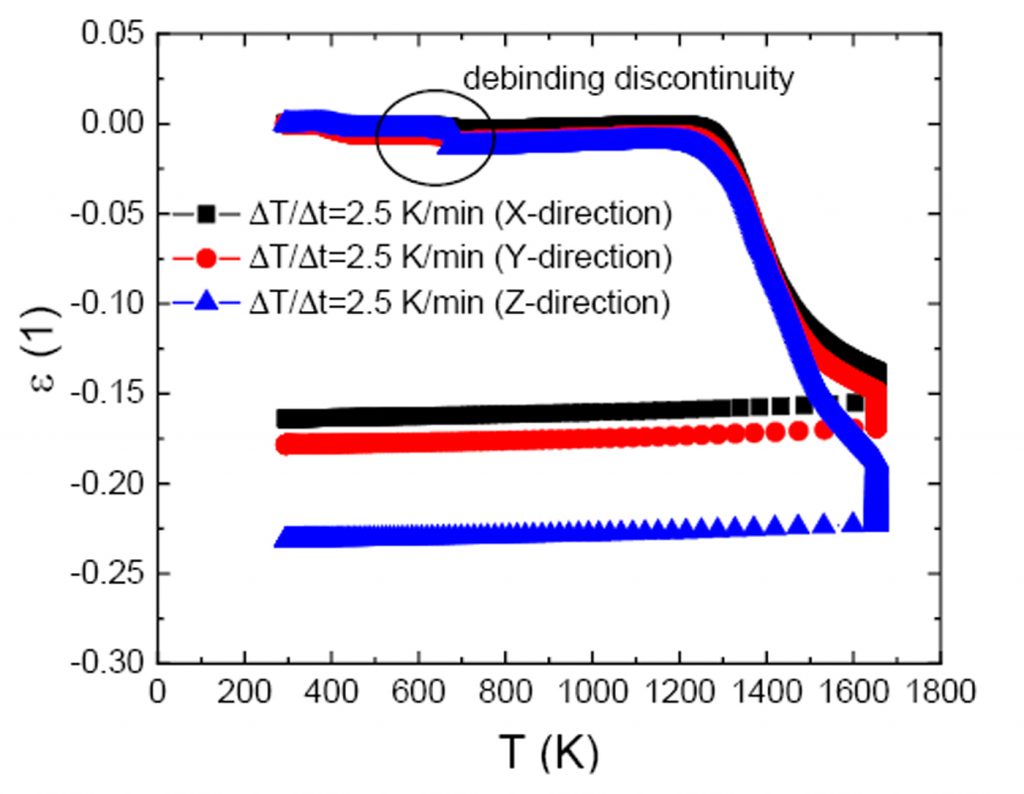
The derived dilatometric sintering results of FSLA are shown in Figs. 4 and 5. The thermal expansion of the cylindrical specimen was successfully compensated. Both paths – the heating up and the cooling down phases – run horizontally in a parallel manner. Smaller discontinuities occur during the debinding at a temperature of T=673.15 K (J=400°C). A potential reason for these discontinuities could be a small volumetric shrinkage of the cylindrical specimen arising from binder evaporation. During debinding, the cylindrical specimens became smaller. Due to this debinding discontinuity, the estimation of the coefficient of thermal expansion CTE is hardly possible in the heating up phase. The cooling down phase is more advantageous, due to the smooth progression of the debound cylindrical specimen. A significant densification and shrinkage started at a temperature of T≈1200 K. Obviously, this temperature T characterises the transition between the initial sintering stage I (particle rearrangement and sintering neck formation) and the intermediate sintering stage II (initial densification and initial grain coarsening) of the investigated FSLA material.
The isothermal sintering plateau has only a small influence on the whole densification and shrinkage process. Depending on the build direction in the BJT process, only an incremental linear axial shrinkage of εaxial≈-3 % can be attributed to the isothermal sintering plateau with a dwell time of t=21600 s (t=6 h). Compared with the complete densification and shrinkage response, the application of such long dwell time t seems to be questionable. The basic build directions (X- and Y-directions) behave comparably, with their densification and shrinkage behaviours being very similar. The vertically built (Z-direction) cylindrical specimens shrink in a different way. They exhibit much higher linear axial shrinkage (εaxial) values.
Consequently, it is very likely that the (final) sintered density (ρs) values and calculated densification parameters (ψ) are incorrect due to the wrong assumption of an isotropic shrinkage. Anisotropic shrinkage phenomena are not understood, on the whole. Often, it is found that the degree of anisotropy Ka=1-(εaxial/εlateral) decreases with increasing sintering progress [10]. Beside the conventional attempts at explanation (for example gravity and dead weight, inhomogeneous density distributions, residual stresses, cold deformations, different sintering mechanisms, crystallographic lattice orientations, trapped gases or different pore morphologies), most of the current attempts incorporate manufacturing-based textures (as observed in MIM, BJT, tape casting, extrusion and die pressing) [6, 10, 11, 12]. The derived results are summarised in Table 2 and Figs. 8 to 11.

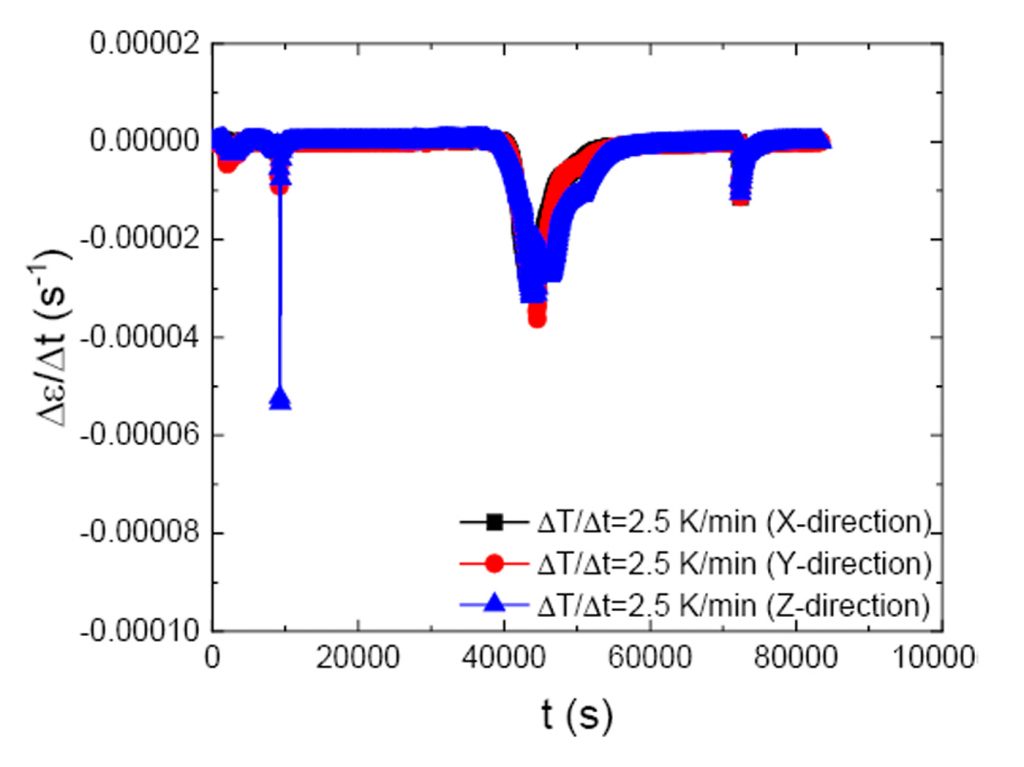
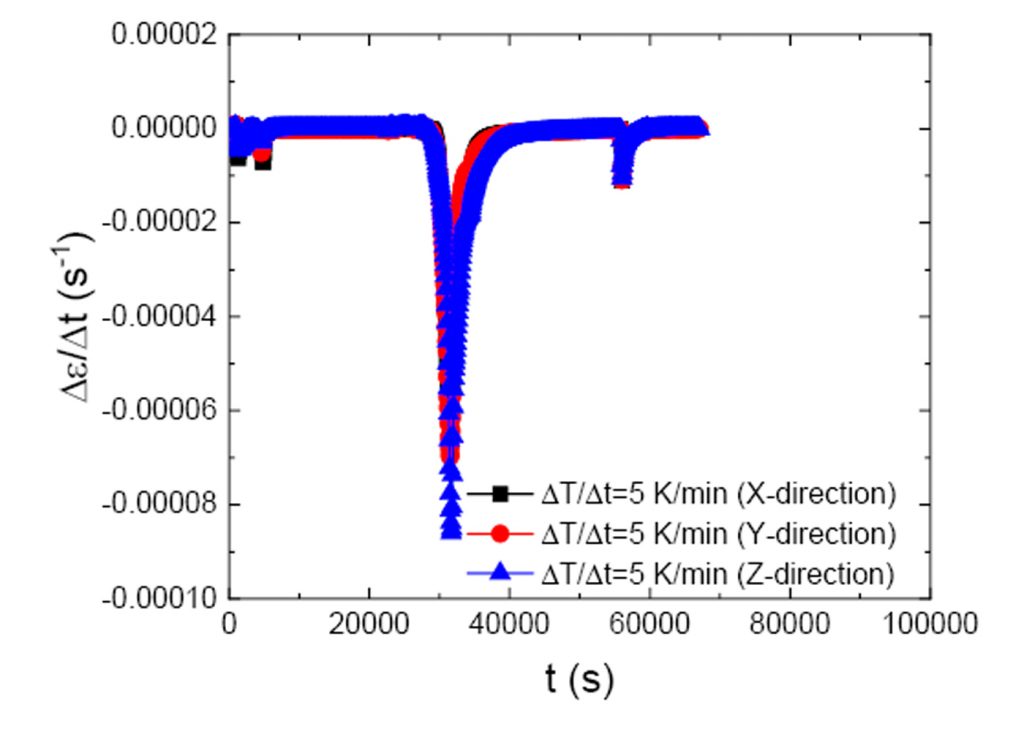
A good approach to investigating the sintering kinetics in more detail is the derivation after time (t) of the dilatometric sintering results from Figs. 4 and 5. Events of higher or lower shrinkage rate (Δε/Δt) can be identified. An adjustment or control of the shrinkage rate (Δε/Δt) could be of interest if two different materials should be sintered together (co-sintering) without interface cracks or warpage, the material is very sensitive with regard to the applied shrinkage rate (Δε/Δt) or if newer sintering concepts (e.g. the Palmour III shrinkage rate controlled sintering approach) should be applied. From Figs. 6 and 7 (and with the assistance of Fig. 3), the highest shrinkage rate (Δε/Δt) is observed at T≈1400 K (long before the chosen maximum sintering temperature of T=1653.15 K). This location corresponds to the steepest slope of the dilatometric sintering results from Figs. 4 and 5. As a conclusion, a potential process optimisation could be the installation of a further sintering plateau in that region. The positive effect of optimised two-step or multiple-step sintering profiles T(t) is mentioned elsewhere. Moreover, further events – for example, the debinding plateau and the initial cooling down – can be identified.
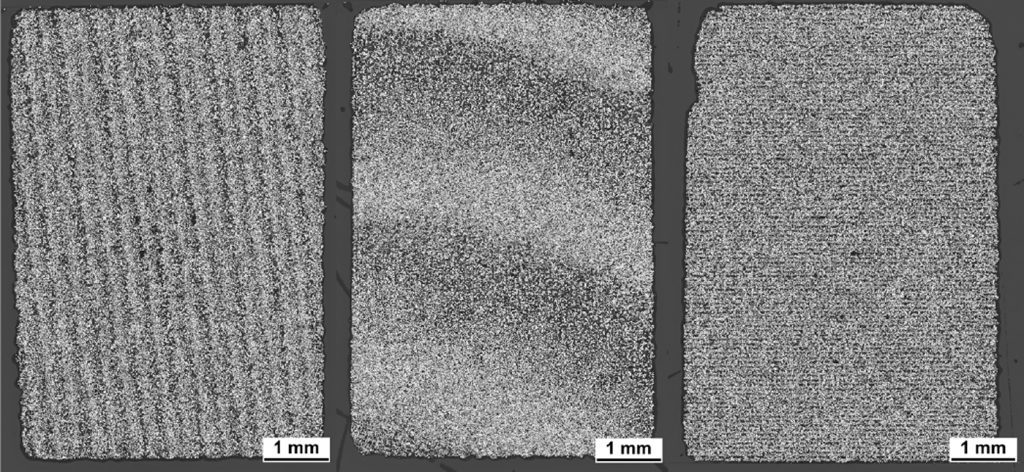
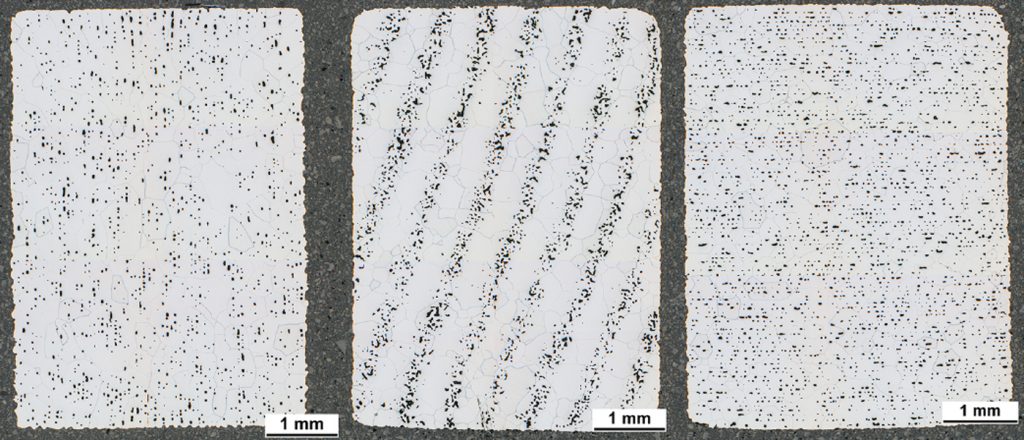
The sintered microstructure and the evolution from the green state (see Fig. 8) to the sintered state (see Fig. 9) are very interesting. The manufacturing-induced textures (we could call them ‘layered porosity’) are clearly visible. The high-temperature sintering at a maximum sintering temperature of T=1653.15 K in the hydrogen pushrod dilatometer led to pronounced grain coarsening. If we assume an initial grain size G50 in the range of the particle size d50 (or smaller) of G50≈d50≈15 μm, a massive grain coarsening up to grain sizes of G≈1 mm can be recognised. The images of the cylindrical specimens built in the X-direction and Z-direction indicate that most of the pores are located within the grain boundaries. That position can be assumed as an energy sink, which makes further densification and pore shrinkage without pressure-assisted and/or field-assisted sintering techniques such as Hot Isostatic Pressing (HIP), Powder Forging (PF) or FAST impossible. Only pores located on the grain boundaries have the chance to heal. Overemphasised grain coarsening will hinder the final densification [11, 13, 14].
Master Sintering Curve
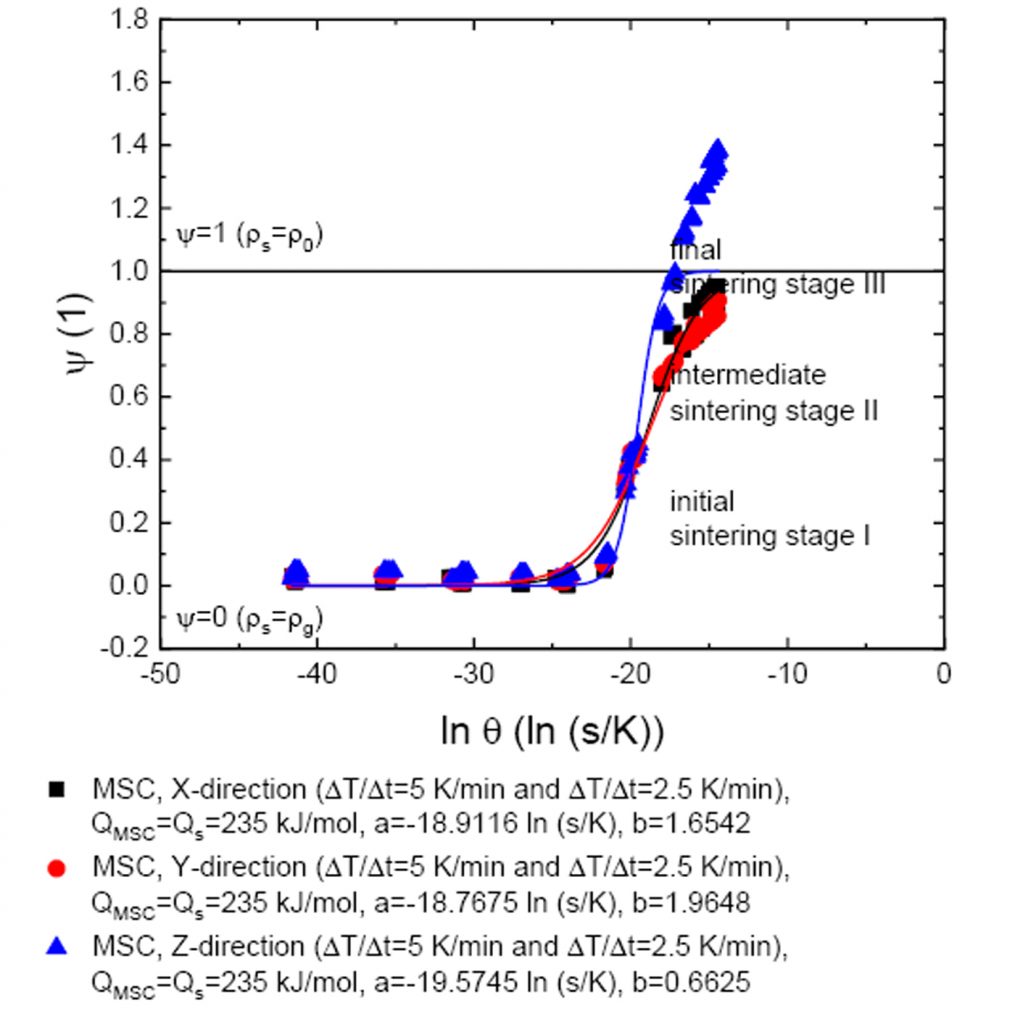
A plot of the (final) relative sintered density (ρs/ρ0), or of the densification parameter (ψ) over the sintering time (t), or the sintering temperature (T) delivers a sigmoidal-shaped curve (first asymptote: ρs=ρg, second asymptote: ρs=ρ0), which can be converted into the MSC to incorporate the whole sintering profiles T(t). As shown in Figs. 10 and 11, the MSC is a plot of the densification parameter (ψ) over the logarithmic sintering work ln θ(t, T) with two free parameters a and b [12-21]:
θ(t, T)=∫1/T(t)exp(-QMSC/RT(t))dt with ψ=1/(1+exp((-ln θ(t, T)-a)/b))
For the simplification of the data analysis, all data points below the homologue Tamman temperature of TD≈666.46 K (chosen: TD=673.15 K [J=400°C due to the debinding plateau]) were not considered, since they do not contribute to the densification and shrinkage. All three sintering stages can be identified from the MSC:
Initial sintering stage I
Particle rearrangement and sintering neck formation accompanied by no shrinkage (powder particle centres remain in position)
Intermediate sintering stage II
Initial densification and initial grain coarsening accompanied by shrinkage (powder particle centres move towards each other)
Final sintering stage III
Final densification, pore separation and final grain coarsening (powder particle centres move towards each other)
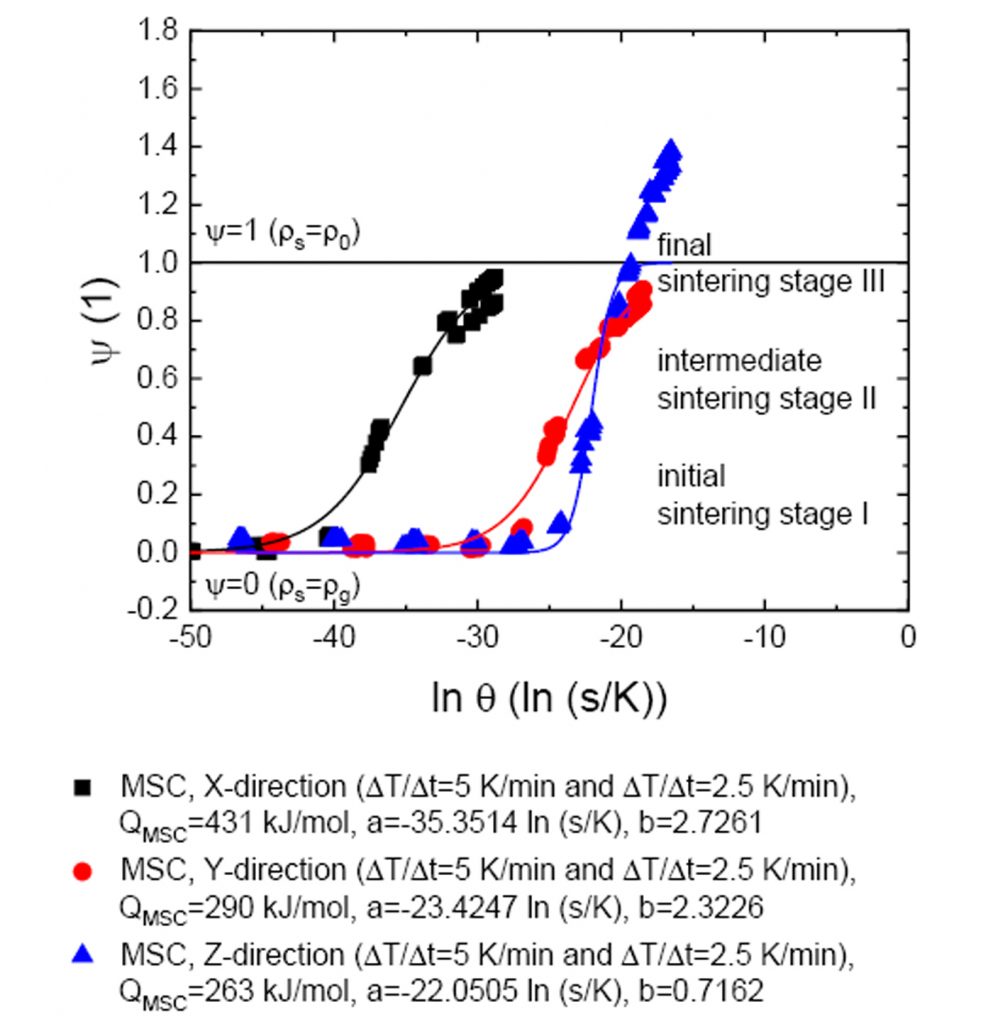
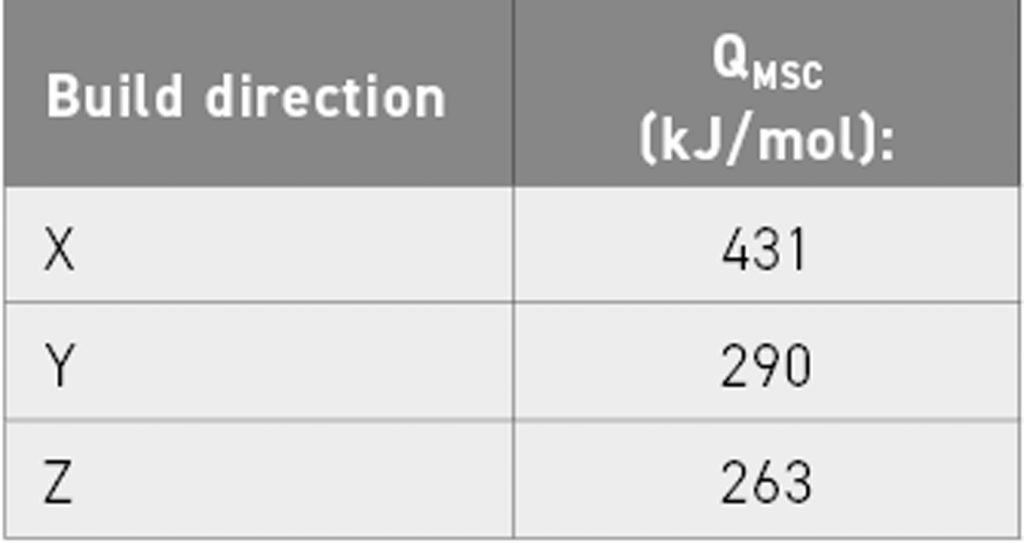
The minimisation of the residuals delivers the apparent activation energy (QMSC) as described in [21]. However, as the initial setting, the apparent activation energy (QMSC) was estimated with the Engel-Brewer theory as QMSC=Qs=RTm(16+V)=235 kJ/mol (with V=1 for a bcc crystallographic lattice structure) as shown in Fig. 10 [12]. The derived (by the minimisation of the residuals) apparent activation energies (QMSC) differ significantly between the three build directions. This affects the sintering process θ(t, T), as shown in Fig. 11. The found apparent acivation energy QMSC values are given in Table 3. Therefore, the ‘resistance against densification and shrinkage’ depends on the build direction. It seems that the cylindrical specimens built in the Z-direction exhibit the lowest apparent activation energy with QMSC=263 kJ/mol (see Table 3).
The second asymptote of the sigmoidal-shaped MSC is touched, but not completely reached. Therefore, it can be concluded that the final sintering stage III is not fully reached, which corresponds to the microscopic observations (see Fig. 9) and the residual porosity (f) above.
The vertically built (Z-direction) cylindrical specimens overshoot the maximum dimensionless densification parameter of ψ=1. This is physically incorrect; a relic of the wrong assumption of isotropic shrinkage. The basic build directions (X-direction and Y-direction) must exhibit lower linear lateral shrinkage (εlateral) values to maintain the theoretical density of ρ0=7.86 g/cm3 and to compensate for the very high linear axial shrinkage values of εaxial(Z-direction)=-23% (averaged between the two heating rates ΔT/Δt). Unfortunately, that hypothesis cannot be verified with pushrod dilatometers. A subsequently performed calliper measurement of the lateral dimension (further differentiation between the basic build directions of the diameter d is not possible) of the final sintering state led to εlateral(Z-direction)=-13 % (ΔT/Δt=2.5 K/min) and εlateral(Z-direction)=-14 % (ΔT/Δt=5 K/min). As a result, the dimensionless densification parameter exhibits more realistic values with ψ<1.
The measurements of all other linear lateral shrinkage values εlateral(X-direction) and εlateral(Y-direction) are not meaningful because the diameter d is affected by shape deviations from the anisotropic shrinkage. From the individual apparent activation energies (QMSC) from Fig. 11, we can see that the sintering kinetics are also affected by the build direction. Even if the activation energy for self-diffusion Qs of bulk materials depends only on the chemical system (diffusion partners), the crystallographic host lattice structure and the diffusion path, two other dependencies can be assumed for particulate materials: the effect of the particle size d50 and of the manufacturing-induced texture, or layered porosity.
Final conclusions
From the obtained results, we can draw several conclusions. Firstly, the intermediate sintering stage II starts and the initial sintering stage I ends at T≈1200 K. The highest shrinkage rate Δε/Δt is observed at T≈1400 K (far below the chosen maximum sintering temperature of T=1653.15 K). The final sintering stage III is not reached, due to the larger pores remaining inside the grains. Secondly, a debinding discontinuity appears at a temperature of T=673.15 K during the heating stage. It is not seen during cooling. Further, a coefficient of thermal expansion of CTE=10*10-6 K-1 leads to horizontal and parallel heating up and cooling down phases. The cooling down phase is much smoother and therefore better for the derivation of the coefficient of thermal expansion CTE.
This study found that there is no effect of the applied heating rates ΔT/Δt visible. Moreover, the basic build directions (X- and Y-direction) have no effect on the final linear axial shrinkage εaxial (εaxial(X-direction)=εaxial(Y-direction)=-17% (averaged between the two heating rates ΔT/Δt)), whereas the final linear axial shrinkage εaxial(Z-direction) of the vertically built cylindrical specimens is much higher (εaxial(Z-direction)=-23% [averaged between the two heating rates ΔT/Δt]). The effect of gravity cannot solely explain the results, because of the horizontal orientation inside the pushrod dilatometer.
The binder jetted FSLA material in this study was shown to behave anisotropically with the chosen process parameters. Therefore, the CAD scaling factors during the BJT build must be adjusted depending on the build direction in order to guarantee a good shape accuracy of the final components after sintering. However, due to this research and the deep understanding of the sintering kinetics it was possible to improve the sintering response significantly. With the help of two-step sintering profiles T(t), adjusted sintering plateaux and a suppressed grain coarsening much better results can be obtained.
Authors
Markus Schneider ([email protected]) and Dennis Wawoczny
GKN Sinter Metals Engineering GmbH
Radevormwald
Germany
Patrick Koehnen
GKN Additive
Bonn
Germany
Christopher T Schade
Hoeganaes Corporation
Cinnaminson
USA
References
[1] H. Riedel: personal communications 2020
[2] H. Riedel: Sintern in W. Kollenberg: Technische Keramik, Vulkan Verlag, Essen, 1st edition, 2009
[3] C. Schade, T. Murphy, K. Horvay, A. Lawley, R. Doherty: Development of a Free-Sintering-Low-Alloy (FSLA) Steel for the Binder-Jet Process; Proc. Advances in Additive Manufacturing with Powder Metallurgy 2021 Orlando; MPIF, Princeton, 2021
[4] W. F. Hemminger, H. K. Cammenga: Methoden der Thermischen Analyse, Springer-Verlag, Berlin, 1st edition, 1989
[5] H. Utschick: Anwendungen der Thermischen Analyse, ecomed Verlagsgesellschaft, Landsberg, 1st edition, 1996
[6] H. Friedrich, H. Ziebold, F. Raether: Debinding and Sintering Investigations using Optical Dilatometry in Combination with Finite Element Analysis; Proc. Euro PM 2019 Maastricht, Proc. USB, No. 4346419; EPMA, Shrewsbury, 2019
[7] E. Ivers-Tiffée, W. Münch: Werkstoffe der Elektrotechnik, Teuber Verlag, Wiesbaden, 10th edition, 2007
[8] O. Guillon, M. Bram: Kurzzeitsintern – Vergleich der Verfahren, Hagener Symposium, 2015, p. 35-57
[9] S.-J. L. Kang: Sintering, Elsevier Butterworth-Heinemann, Oxford, 1st edition, 2005
[10] K. Korn, T. Kraft, H. Riedel: Modelling of anisotropic shrinkage during liquid phase sintering, Sintering 05, 2005, p. 260-263
[11] H. E. Exner: Grundlagen von Sintervorgängen, Gebrüder Bornträger, Berlin, Stuttgart, 1st edition, 1978
[12] M. Schneider, P. Gabriel, S. Höges, C. Schaak: The Master Sintering Curve And Its Application On 316L Steel Produced By Binder Jetting; Proc. Euro PM 2020 Lisbon, Proc. USB, No. 4851472; EPMA, Shrewsbury, 2020
[13] R. M. German, S. J. Park: Handbook of Mathematical Relations in Particulate Materials Processing, John Wiley & Sons, Hoboken, 1st edition, 2008
[14] R. M. German: Sintering: From Empirical Observations to Scientific Principals, Butterworth-Heinemann, Waltham, 1st edition, 2014
[15] H. Su, D. L. Johnson: Master Sintering Curve: A Practical Approach to Sintering, J. Am. Ceram. Soc., Vol. 79, 1996, p. 3211-3217
[16] D. C. Blaine, J. D. Gurosik, S. J. Park, D. F. Heaney, R. M. German: Master Sintering Curve Concept as Applied to the Sintering of Molybdenum, Metall. Mater. Trans., Vol. 37A, 2006, p. 715-720
[17] S. J. Park, J. M. Martin, J. F. Guo, J. L. Johnson, R. M. German: Densification Behavior of Tungsten Heavy Alloy Based on Master Sintering Curve Concept, Metall. Mater. Trans., Vol. 37A, 2006, p. 2837-2848
[18] S. J. Park, S. H. Chung, J. M. Martin, J. L. Johnson, R. M. German: Master Sintering Curve for Densification Derived from Constitutive Equation with Consideration of Grain Growth: Application to Tungsten Heavy Alloys, Metall. Mater. Trans., Vol. 39A, 2008, p. 2941-2948
[19] S. J. Park, P. Suri, E. Olevsky, R. M. German: Master Sintering Curve Formulated from Constitutive Models, J. Am. Ceram. Soc., Vol. 92, 2009, p. 1410-1413
[20] M. W. Reiterer, K. G. Ewsuk: An Analysis of Four Different Approaches to Control and Predict Sintering, J. Am. Ceram. Soc., Vol. 92, 2009, p. 1419-1427
[21] M.-H. Teng, Y.-C. Lai, Y.-T. Chen: A Computer Program Of Master Sintering Curve Model To Accurately Predict Sintering Results, Western Pacific Earth Science, Vol. 2, No. 2, 2002, p. 171-180